User Survey (series)
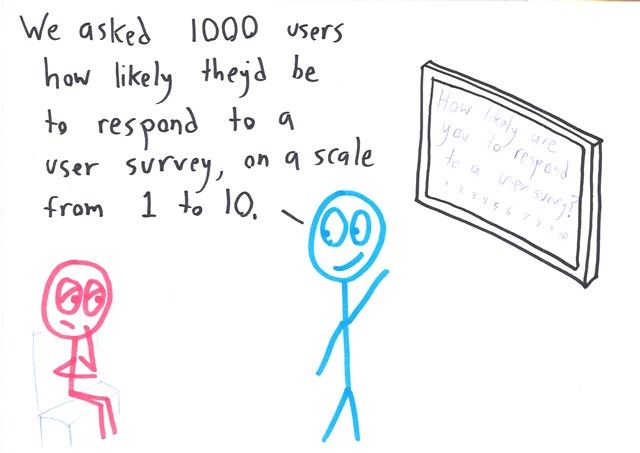
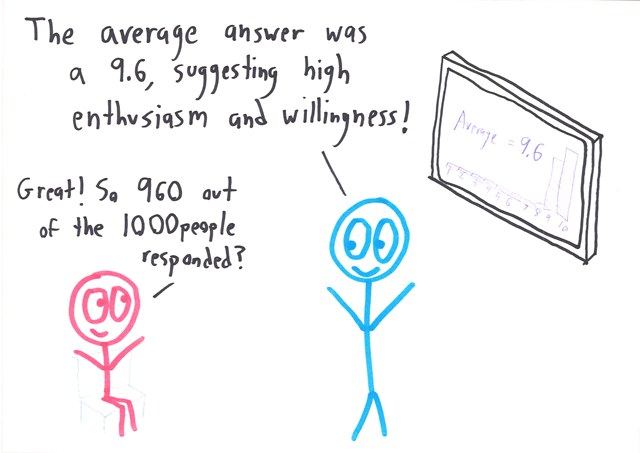
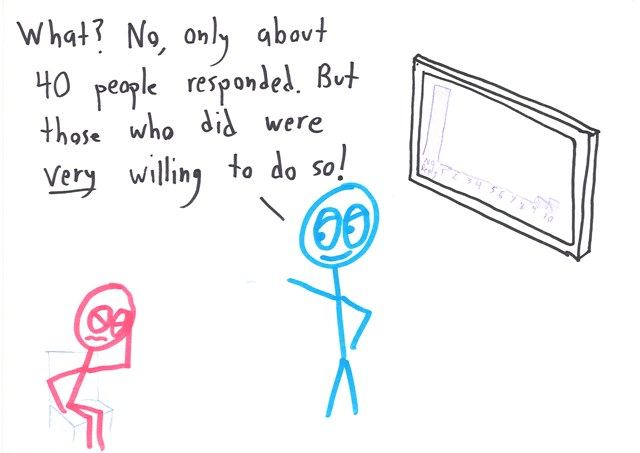
A presenter touts a survey showing people love surveys, then admits only 40 of 1,000 responded.
Use this cartoon
Free for classrooms, worksheets, slides and other non-commercial use under CC BY-NC 4.0, with credit to Ben Orlin.
Cartoon by Ben Orlin, Math with Bad Drawings. https://cartoons.mathwithbaddrawings.com/2015-01-01-user-survey/ (CC BY-NC 4.0)Transcript
[1] A: "We asked 1000 users how likely they'd be to respond to a user survey, on a scale from 1 to 10."
[2] A: "The average answer was a 9.6, suggesting high enthusiasm and willingness!" B: "Great! So 960 out of the 1000 people responded?"
[3] A: "What? No, only about 40 people responded. But those who did were very willing to do so!"