Too Many Podcasts
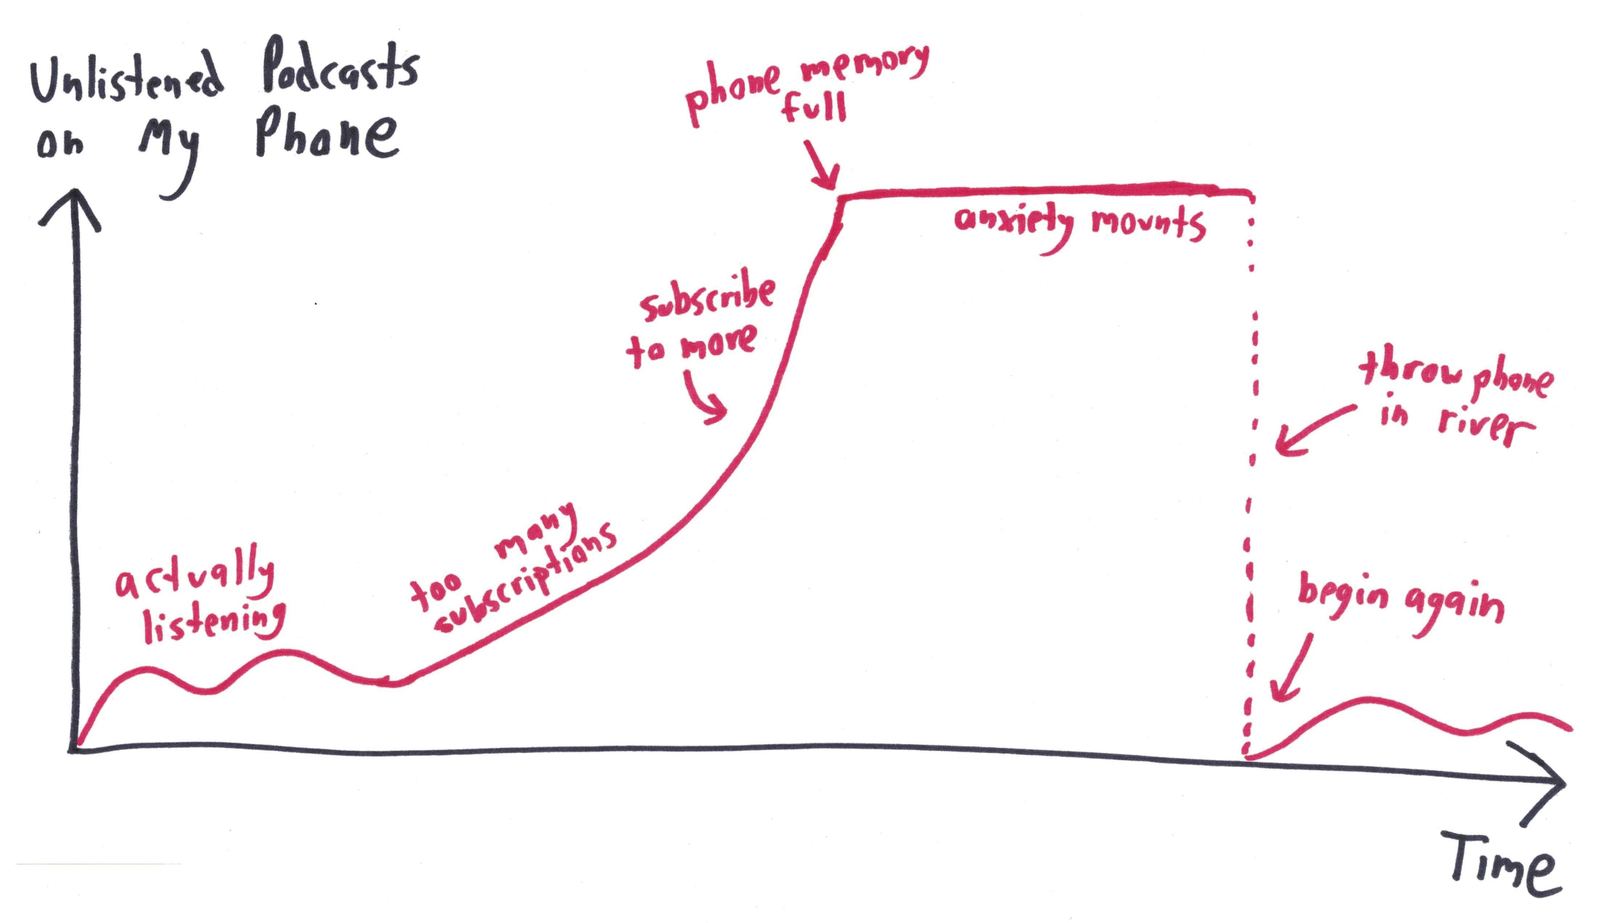
A hand-drawn line graph of unlistened podcasts over time, rising until the phone fills up, then dropping to zero after the phone goes in a river.
Use this cartoon
Free for classrooms, worksheets, slides and other non-commercial use under CC BY-NC 4.0, with credit to Ben Orlin.
Cartoon by Ben Orlin, Math with Bad Drawings. https://cartoons.mathwithbaddrawings.com/2017-11-17-too-many-podcasts/ (CC BY-NC 4.0)Transcript
[Graph: Unlistened Podcasts on My Phone vs. Time] "actually listening" → "too many subscriptions" → "subscribe to more" → "phone memory full" → "anxiety mounts" → "throw phone in river" → "begin again"