Gingerbread Man
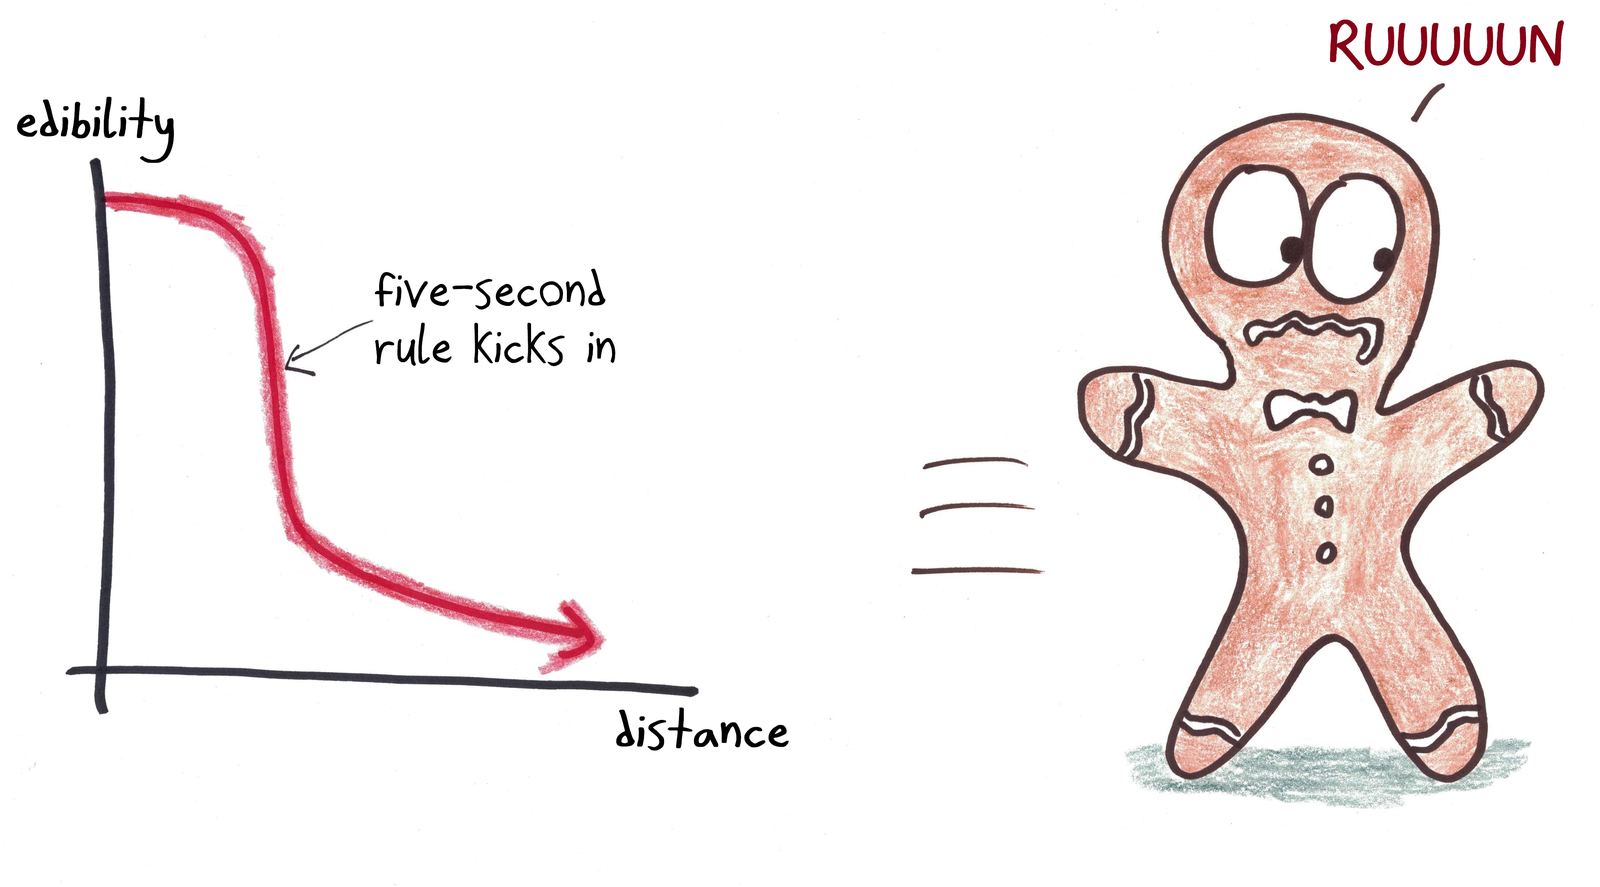
A graph shows a gingerbread man's edibility dropping as he runs farther, with a cliff where the five-second rule kicks in.
Use this cartoon
Free for classrooms, worksheets, slides and other non-commercial use under CC BY-NC 4.0, with credit to Ben Orlin.
Cartoon by Ben Orlin, Math with Bad Drawings. https://cartoons.mathwithbaddrawings.com/2018-04-04-gingerbread-man/ (CC BY-NC 4.0)Transcript
[Graph: edibility (y) vs. distance (x), with a sharp drop labeled "five-second rule kicks in"]
Gingerbread man (running): "RUUUUUN"