Understanding Your Teaching
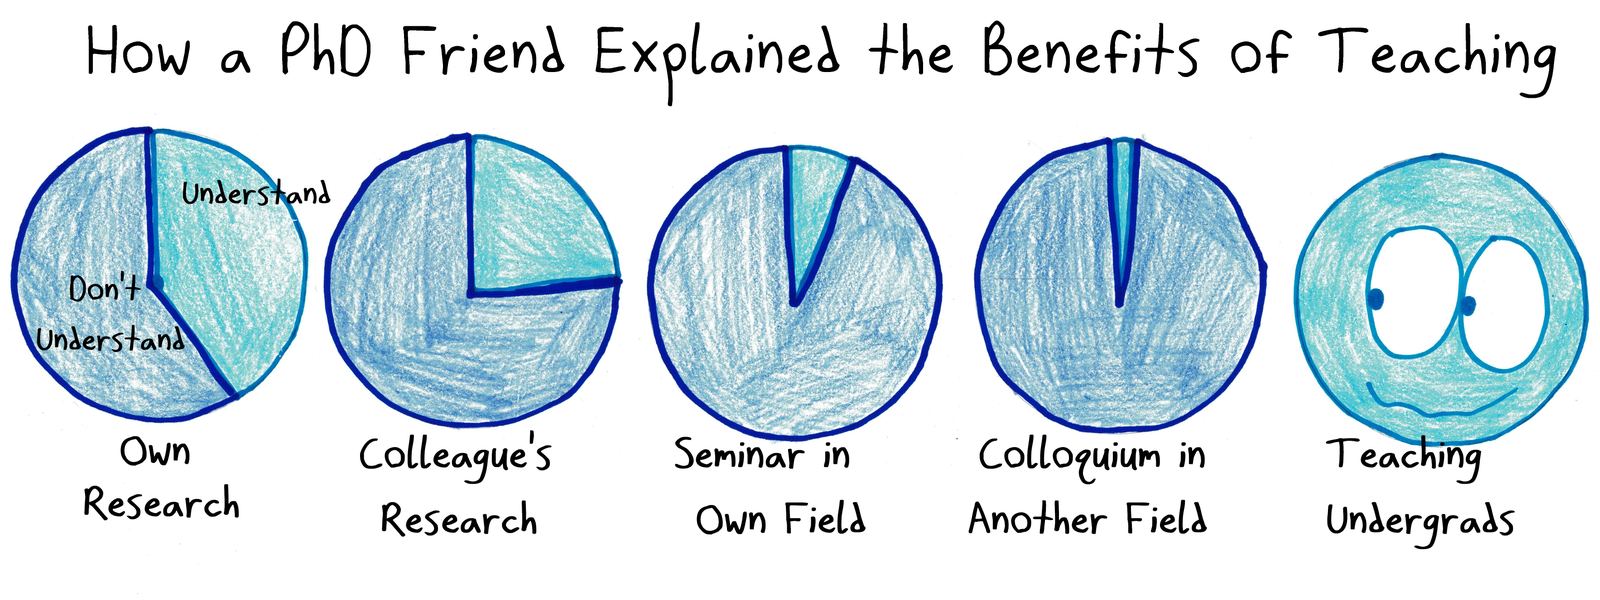
A row of pie charts shows a PhD student understanding less and less of research talks, until teaching undergrads, the one thing they fully understand.
Use this cartoon
Free for classrooms, worksheets, slides and other non-commercial use under CC BY-NC 4.0, with credit to Ben Orlin.
Cartoon by Ben Orlin, Math with Bad Drawings. https://cartoons.mathwithbaddrawings.com/2018-05-24-understanding-your-teaching/ (CC BY-NC 4.0)Transcript
[Title] "How a PhD Friend Explained the Benefits of Teaching"
[Pie charts of Understand vs. Don't Understand] Own Research (about half understood) · Colleague's Research (a quarter) · Seminar in Own Field (a sliver) · Colloquium in Another Field (a hairline) · Teaching Undergrads (fully understood: a smiling face)