Boston Driving
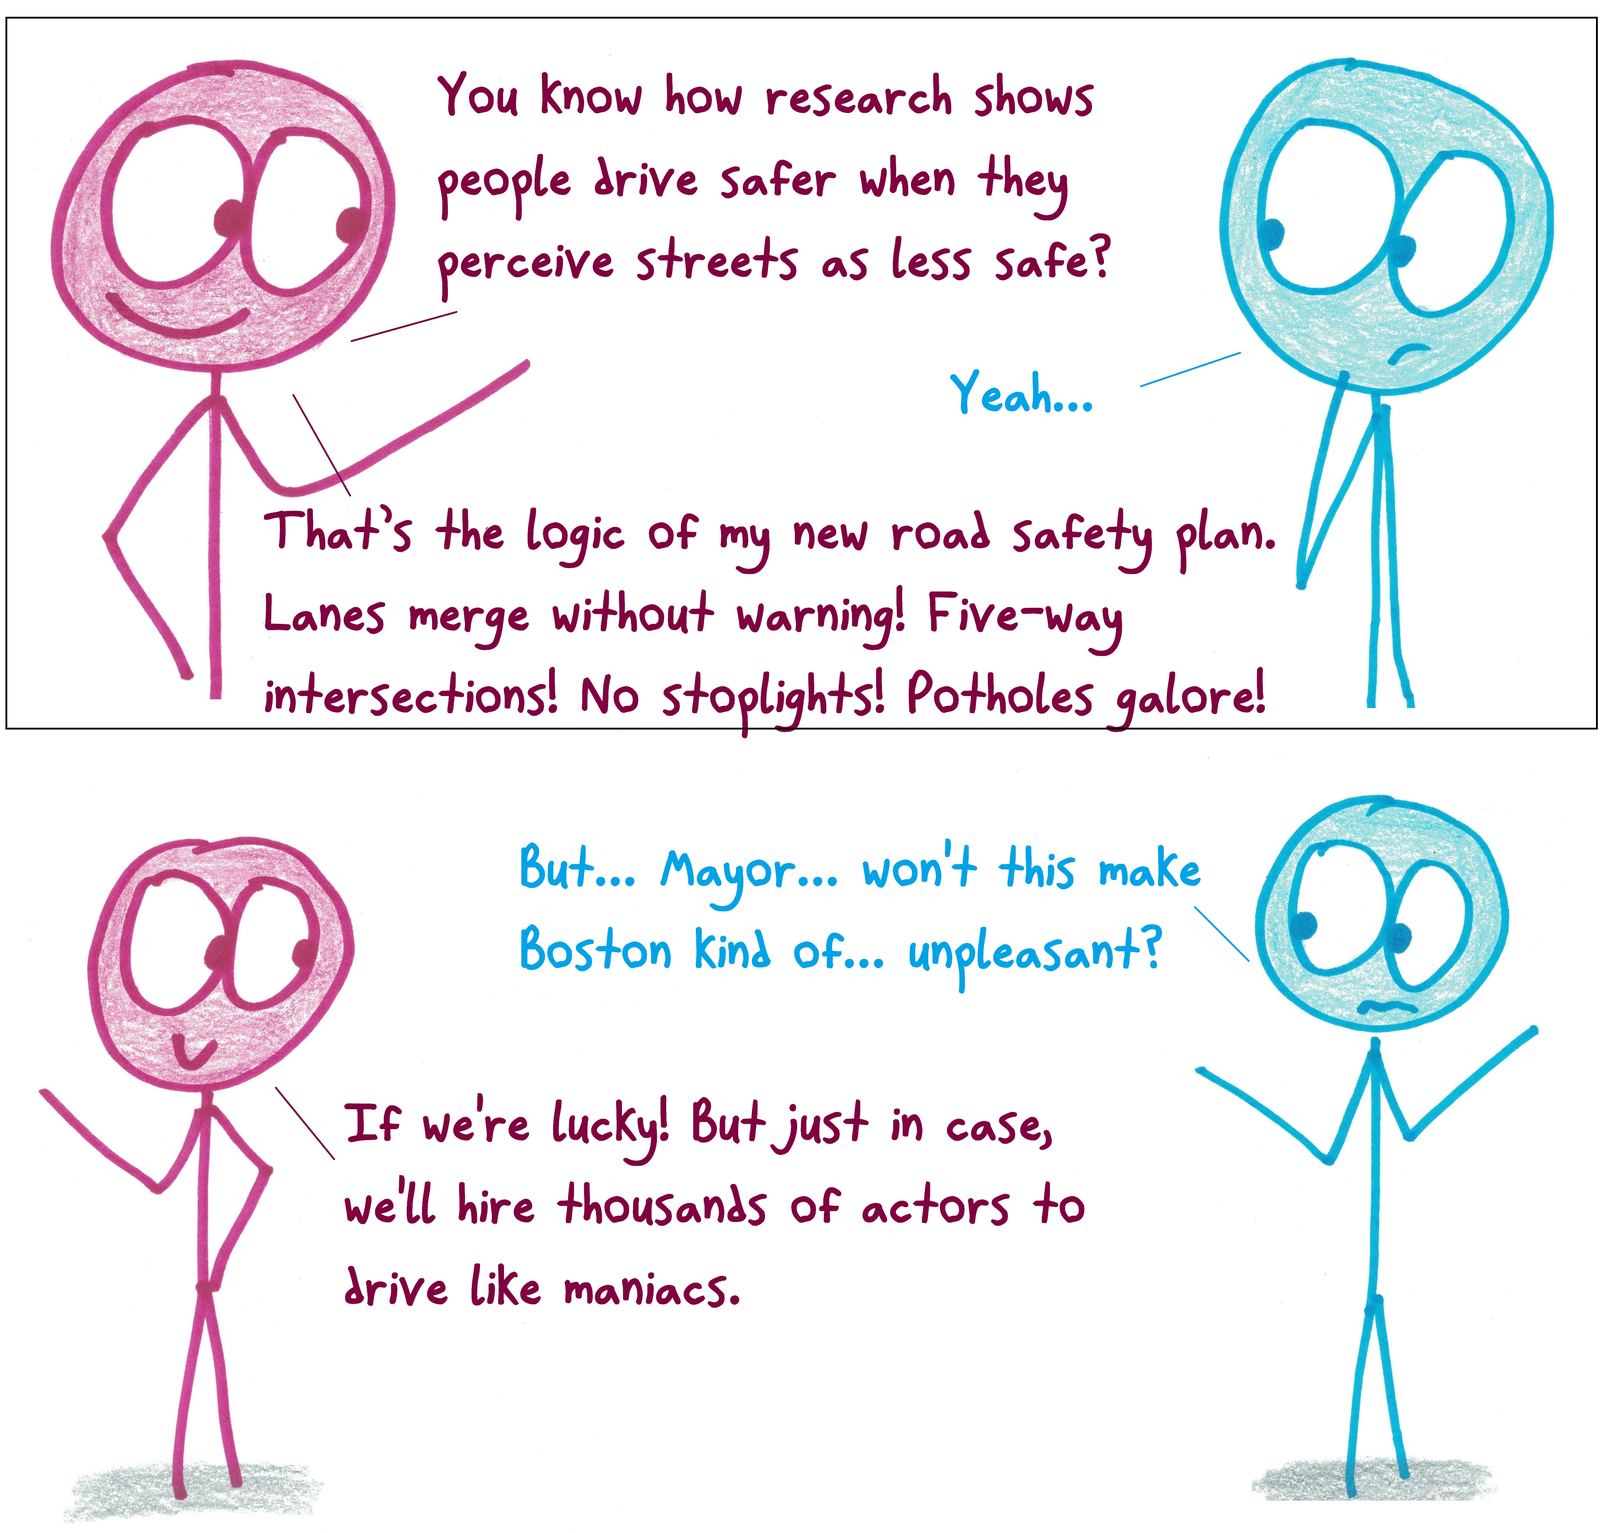
A mayor applies research on risk perception to explain Boston's chaotic streets.
Use this cartoon
Free for classrooms, worksheets, slides and other non-commercial use under CC BY-NC 4.0, with credit to Ben Orlin.
Cartoon by Ben Orlin, Math with Bad Drawings. https://cartoons.mathwithbaddrawings.com/2018-09-11-boston-driving/ (CC BY-NC 4.0)Transcript
A: "You know how research shows people drive safer when they perceive streets as less safe?" B: "Yeah..."
A: "That's the logic of my new road safety plan. Lanes merge without warning! Five-way intersections! No stoplights! Potholes galore!"
B: "But... Mayor... won't this make Boston kind of... unpleasant?" A: "If we're lucky! But just in case, we'll hire thousands of actors to drive like maniacs."