Faked Data Digit Distribution
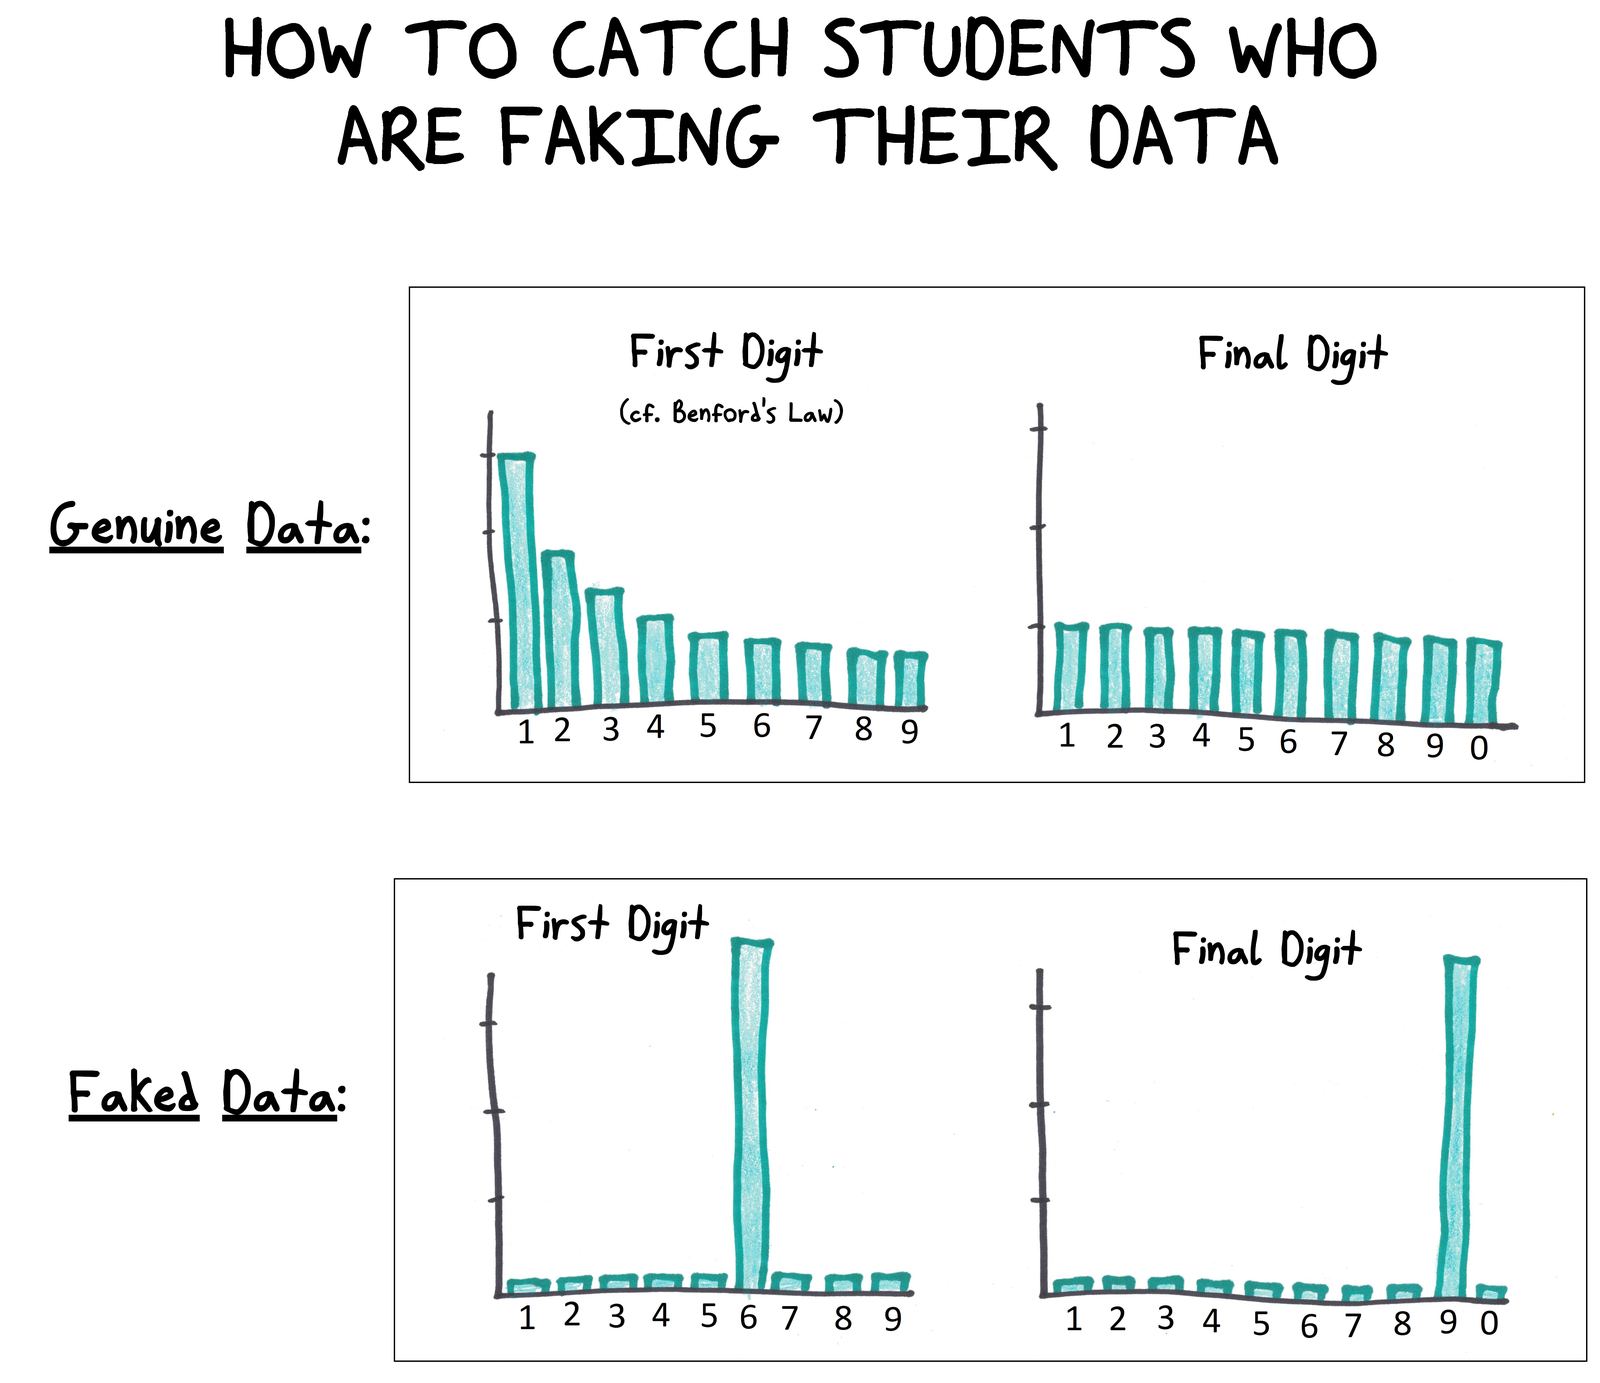
Bar charts compare digit distributions: real data follows Benford's Law and uniform final digits, while faked data shows suspicious spikes.
Use this cartoon
Free for classrooms, worksheets, slides and other non-commercial use under CC BY-NC 4.0, with credit to Ben Orlin.
Cartoon by Ben Orlin, Math with Bad Drawings. https://cartoons.mathwithbaddrawings.com/2018-09-24-faked-data-digit-distribution/ (CC BY-NC 4.0)Transcript
[Title] "HOW TO CATCH STUDENTS WHO ARE FAKING THEIR DATA"
Genuine Data: First Digit (cf. Benford's Law) — decreasing bars from 1 to 9; Final Digit — roughly uniform.
Faked Data: First Digit — one giant spike at 6; Final Digit — one giant spike at 9.