Poor 25-Year-Olds
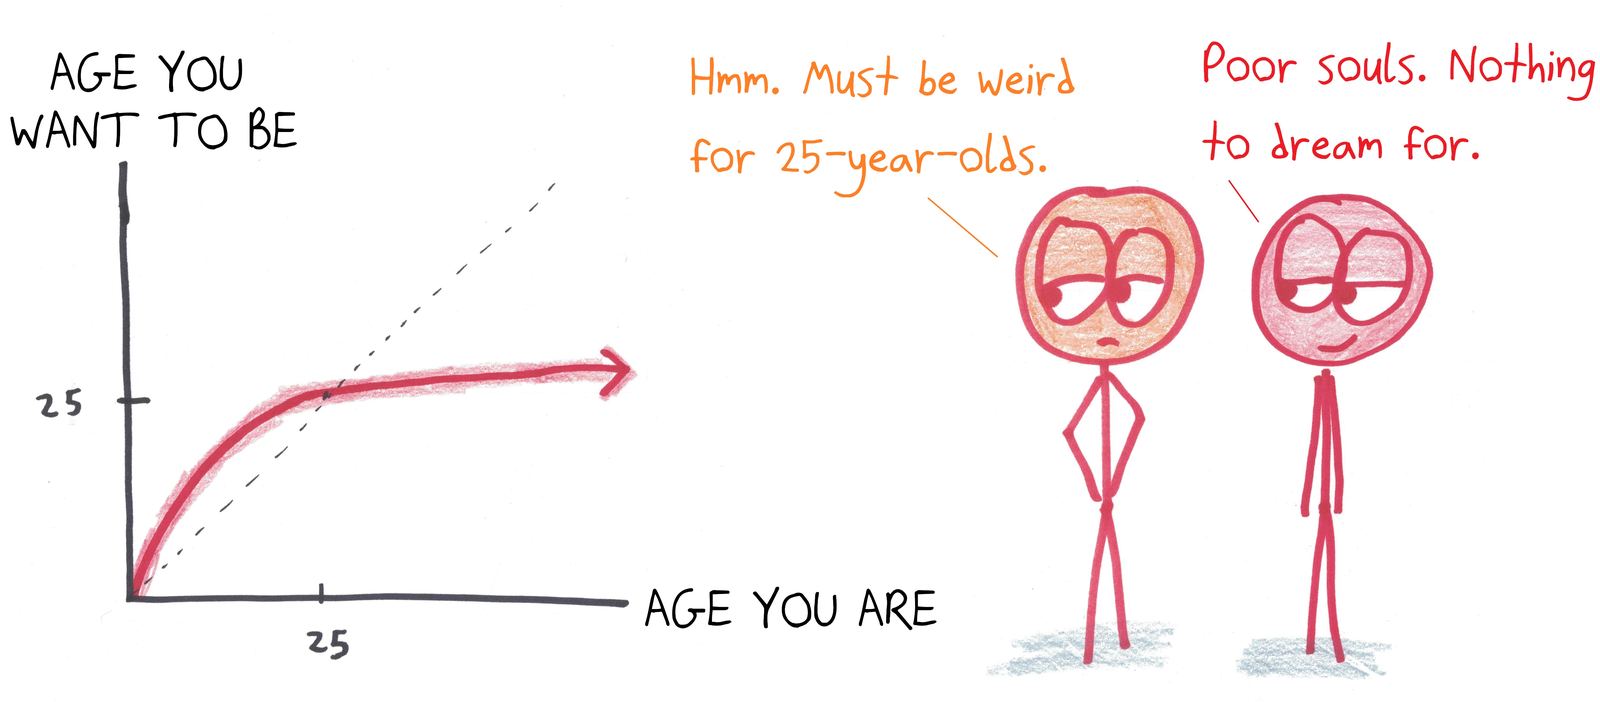
A graph of the age people want to be versus their actual age crosses the line y = x at 25, the one age that wants to be exactly itself.
Use this cartoon
Free for classrooms, worksheets, slides and other non-commercial use under CC BY-NC 4.0, with credit to Ben Orlin.
Cartoon by Ben Orlin, Math with Bad Drawings. https://cartoons.mathwithbaddrawings.com/2018-10-09-poor-25-year-olds/ (CC BY-NC 4.0)Transcript
[Graph: AGE YOU WANT TO BE vs. AGE YOU ARE — curve rises above the line y = x, levels off at 25, crossing the line at 25]
A: "Hmm. Must be weird for 25-year-olds." B: "Poor souls. Nothing to dream for."