How Was Your Run?
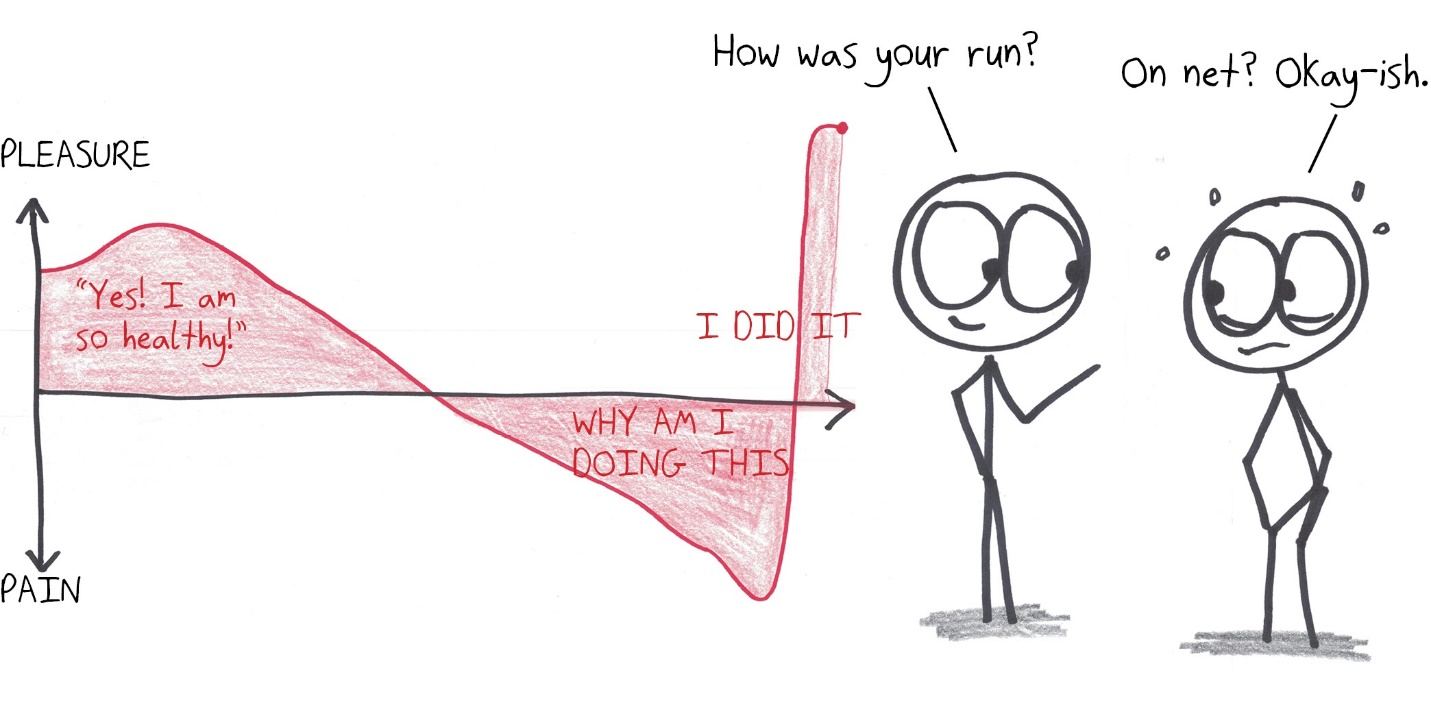
A run graphed as pleasure minus pain: a happy start, a long miserable middle, a triumphant spike at the end. The net area works out to okay-ish.
Transcript
[Graph of PLEASURE/PAIN over a run: "Yes! I am so healthy!" then dipping into "WHY AM I DOING THIS," then a spike at the end: "I DID IT"] "How was your run?" "On net? Okay-ish."
Use this cartoon
Free for classrooms, worksheets, slides and other non-commercial use under CC BY-NC 4.0, with credit to Ben Orlin.
Cartoon by Ben Orlin, Math with Bad Drawings. https://cartoons.mathwithbaddrawings.com/2019-10-08-how-was-your-run/ (CC BY-NC 4.0)