Aversion to Usefulness
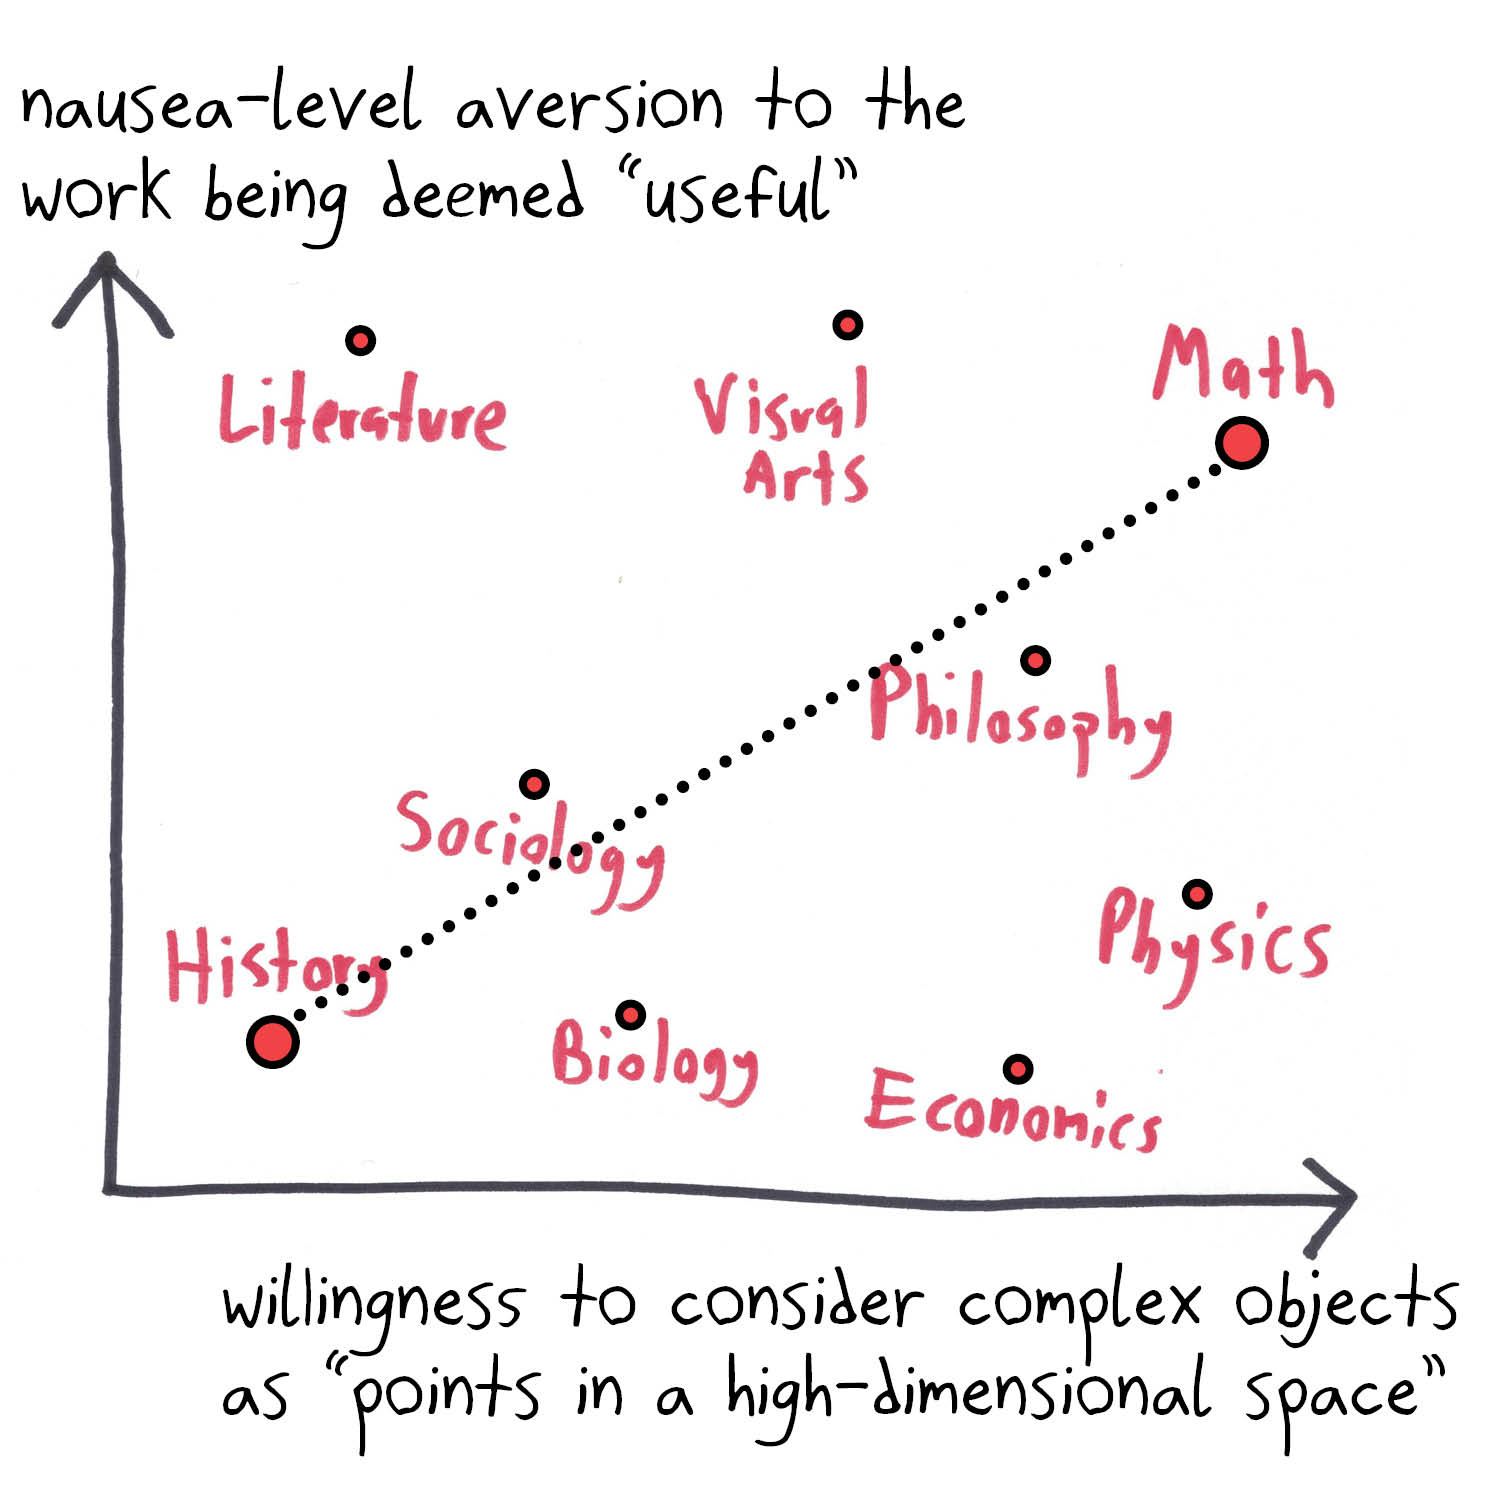
A scatter plot of academic fields by aversion to usefulness and love of high-dimensional thinking, with math at the extreme of both.
Use this cartoon
Free for classrooms, worksheets, slides and other non-commercial use under CC BY-NC 4.0, with credit to Ben Orlin.
Cartoon by Ben Orlin, Math with Bad Drawings. https://cartoons.mathwithbaddrawings.com/2024-01-01-aversion-to-usefulness/ (CC BY-NC 4.0)Transcript
[Scatter plot] x-axis: willingness to consider complex objects as "points in a high-dimensional space"; y-axis: nausea-level aversion to the work being deemed "useful." Points: History (low, low), Biology, Sociology, Economics, Physics, Philosophy, Literature, Visual Arts, Math (high, high), with a dotted line from History to Math.