Why Not to Trust Statistics: Mode
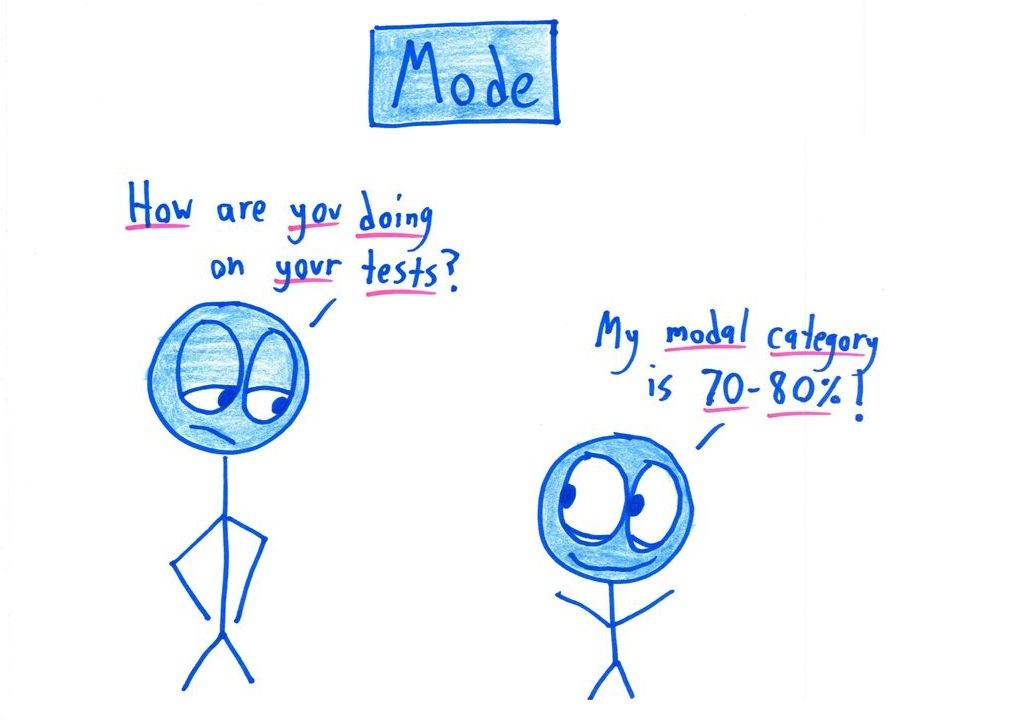
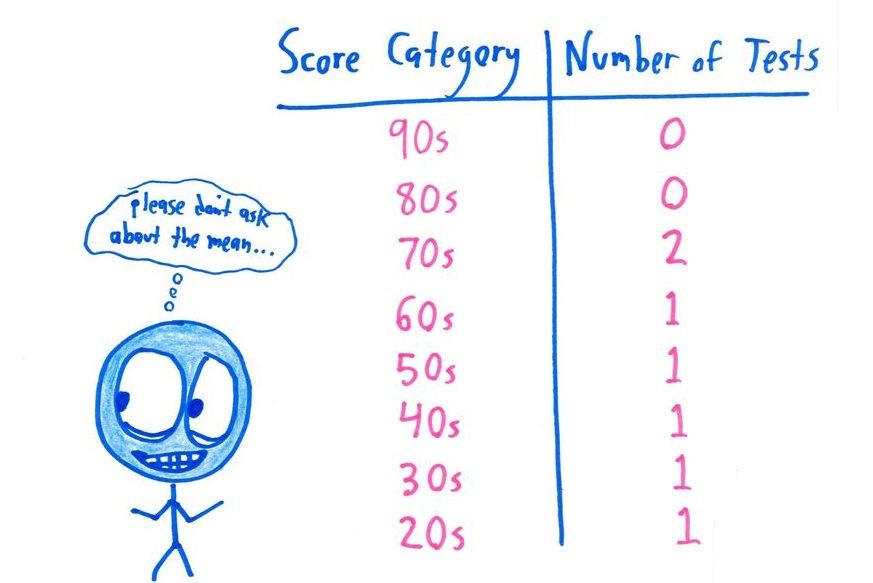
A student's 'modal category is 70–80%', but the table shows scores sliding down into the 20s.
Use this cartoon
Free for classrooms, worksheets, slides and other non-commercial use under CC BY-NC 4.0, with credit to Ben Orlin.
Cartoon by Ben Orlin, Math with Bad Drawings. https://cartoons.mathwithbaddrawings.com/2016-07-13-why-not-to-trust-statistics--mode/ (CC BY-NC 4.0)Transcript
Mode: "How are you doing on your tests?" "My modal category is 70–80%!"
Score Category | Number of Tests: 90s 0, 80s 0, 70s 2, 60s 1, 50s 1, 40s 1, 30s 1, 20s 1. (thinks: "please don't ask about the mean…")